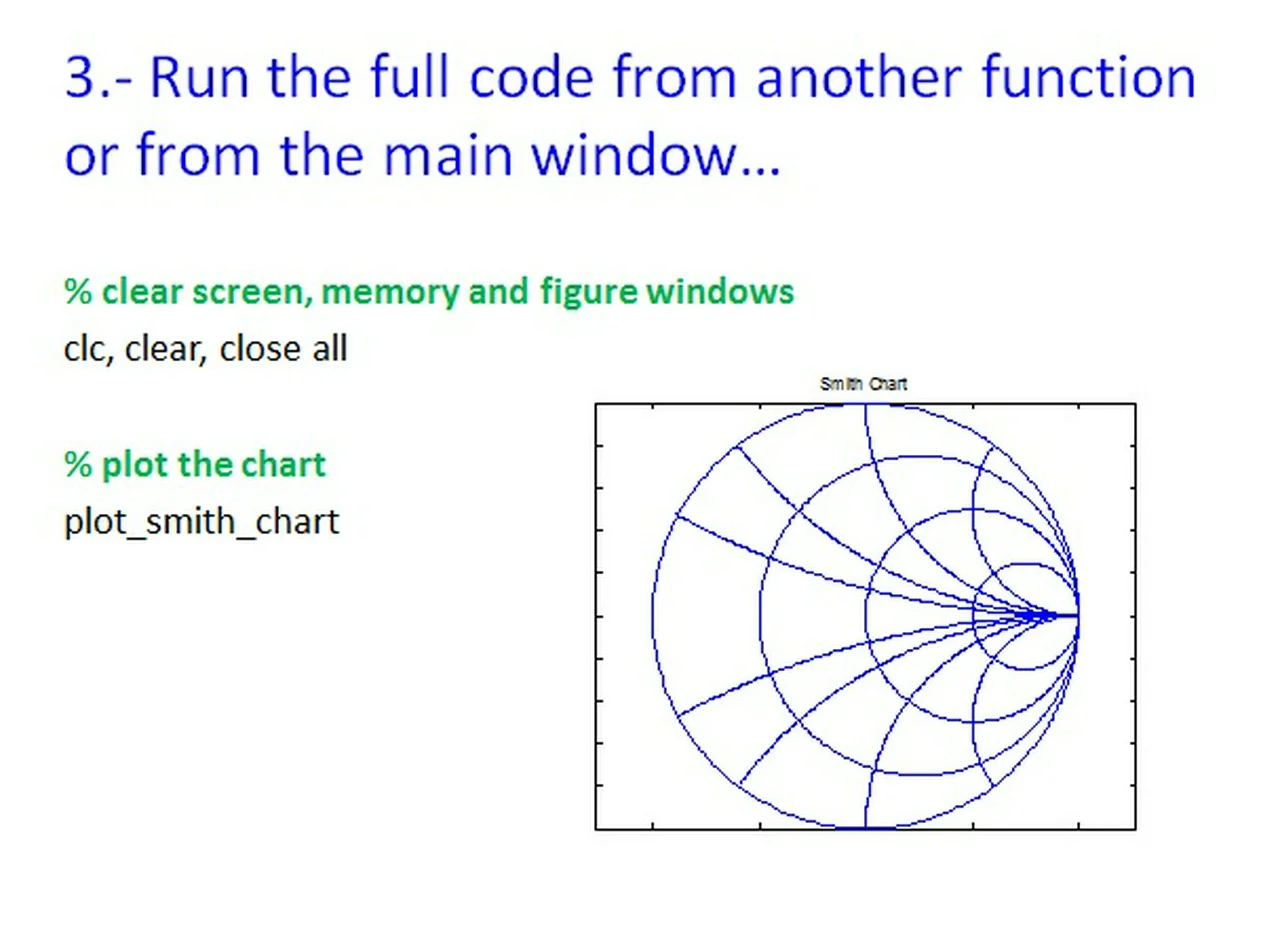
A Smith Chart is just a group of circles and portions of circles (arcs).
We need to develop a function that plots a circle and call it several times to plot horizontally aligned circles with different centers and radii, and call that function again to plot vertically aligned portions of circles.
In this video I show you how to do curve fitting in Matlab, using the built-in functions polyfit and polyval.
Some relevant links:
Polynomial Regression
http://matrixlab-examples.com/polynomial-regression.html
Curve Fitting with built-in tools
http://matrixlab-examples.com/curve-fitting.html
Woriking with Polynomials in Matlab
http://matrixlab-examples.com/polynomials.html
Matlab - Tutorials and Examples
http://matrixlab-examples.com/matlab-tutorial.html
For more examples and details, visit: http://matrixlab-examples.com/factorials.html
In mathematics, the factorial of a positive integer n, denoted by n!, is the product of all positive integers less than or equal to n.
By definition, the factorial of 0 (noted 0!) is 1.
The shown code is a way of handling it in Matlab.
For more examples and details, visit: http://matrixlab-examples.com/tower-of-hanoi-algorithm.html
The objective of the puzzle is to move all of the disks from tower A to tower C.
Two Easy Rules:
- Only one disk can be moved at a time and it can only be the top disk of any tower.
- Disks cannot be stacked on top of smaller disks.
We’re going to solve this puzzle using recursion.
Recursion is a computer programming technique that involves the use of a procedure that calls itself one or several times until a specified condition is met.
The details are coded in Matlab.