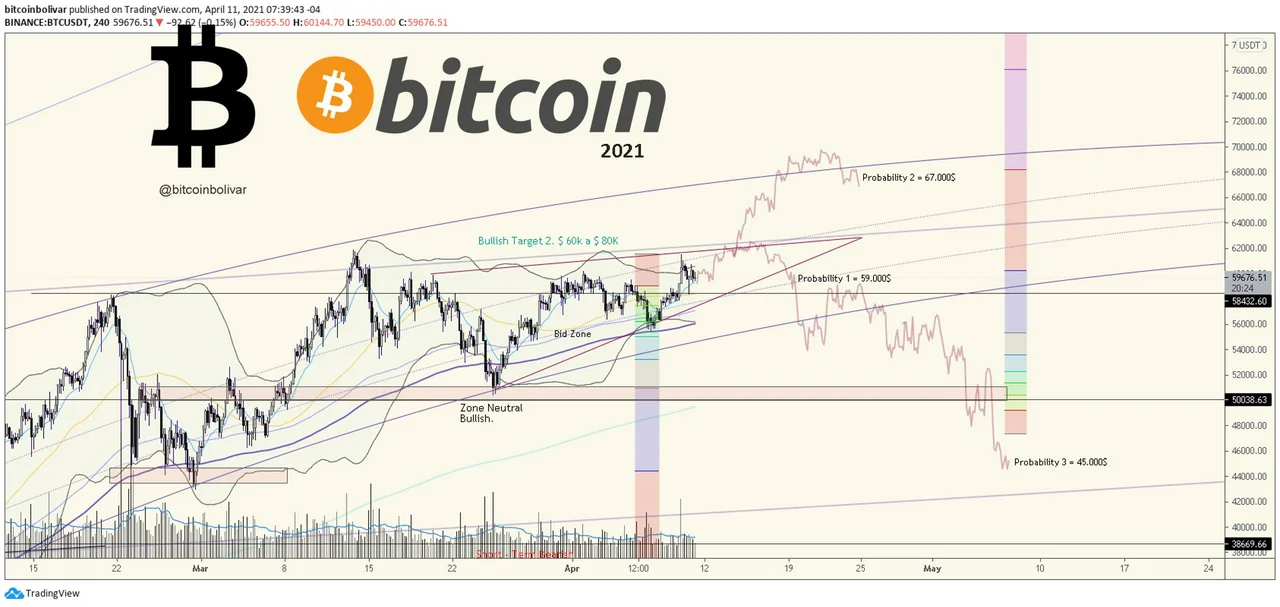
$ BTC vs USDT. Technical Analysis Bitcoin in 4h. 11 April 2021
Bitcoin is in a process of consolidation at the top of the range of its last resistance $61,000. If you fail to break it hard before April 16-20, we may see another fall back to the low end of the range, the 5 50,000 or more
Probability 1. Fall to $ 58.500 and return to $ 59.000 - $59.500 continuing with the consolidation process at these prices.
Probability 2. Quickly climb to $ 64.500 and $ 65.500, maintain the consolidation at these prices and then quickly rise to $ 67.000 and $ 70.000
Probability 3. Fall very quickly to $ 53.000, and return to $ 56.000 continuing with the consolidation process, in case you cannot consolidate at these prices, will continue to $ 45.000.
I am particularly bearish , and more with the average of 200 being parabolic, but if an event occurs outside of expectations and Eth breaks the resistance of $ 244, we can see it rise to $ 260.
Only if you break and hold the price of $ 244 and If we can hold this for some longer time (~ 4 weeks), I will get confident that this is the start of the grand bull
Vladimir Padrino Lopez, el generalote comunista, ministro de defensa del Narcodictador y Terrorista Maduro, es cómplice de la anarquía que hoy se vive en Venezuela. Desmoralizó a las tropas, permitió la integración a las FFAA de las milicias y corrompió al militar. Su paso por el ejercito será recordado como nefasto. Vendió la institución al narcotráfico. ¿Qué palabras le tendrías a este traidor?
Probability 1. Consolidation between $ 1.01 to $ 1.18 to break the resistance of $ 1.5
Probability 2. To break the last resistance of $ 1.19 and go up to $ 1.5 - $ 1.75 while maintaining the price
Probability 3. Fall sharply and quickly to $ 0,65 in the event that bitcoin falls and dragged the market
See this analysis in tradingview: 1w: https://www.tradingview.com/chart/ADAUSDT/qGcC8bR8-The-last-main-resistance-that-Cardano-wants-to-break-1March/
1d: https://www.tradingview.com/chart/XAUUSD/Q1sNh0G4-XAU-vs-USD-Technical-Analysis-XAU-ORO-in-1d-1-March/
Bitcoin resuming his uptrend may stop altseason's uptrend for a few weeks, however, the dominance of bitcoin can still fall to 40% or 35% which supposes the continuation of the altseason period, but if bitcoin resumes its dominance to 50% or more we can be in a pause for some weeks or months
Wall street market makers (Citadel, Renaissance) could arbitrage out this in the coming years.
Last 759 NYSE trading days, Pearson correlation coefficient for S&P500 - BTC/USD: 0.530012 - moderately correlated.
3 waves down, 3 waves up contained within a channel, retracing 90%, looks like we are setting up for a flat correction. I expect a drop to the $30 area.
The Bitcoin trend is very strong. The long-term metrics that I use don't have any signs of reversal, and it doesn't look like they're going to have it for quite some time.
Even in a 4-hour period, the price managed to rebound very strongly from the 100-period average, only the 20-period average did not manage to stay below 50 for long.
*Possible Next Fibonacci confluence zone or distribution to end January is $32k - $38k
*Possible Next Fibonacci confluence zone is $59k-$62k for February to pass the resistance of 42k